

I’m a Starlink and networking nerd, and I use a Starlink Mini for work when I travel in the campervan. I wanted to see how it behaves in different circumstances instead of running one speed test and calling it done. So on October 7, 2026 I logged a Mini from 11:24 AM to 9:27 PM. I ran it on Wi-Fi and on Ethernet, idle and busy, through a big download, a game of Dota 2 and a cold boot (unplugging the dish and plugging it back in). I’m not a serious gamer, so the game is one data point.
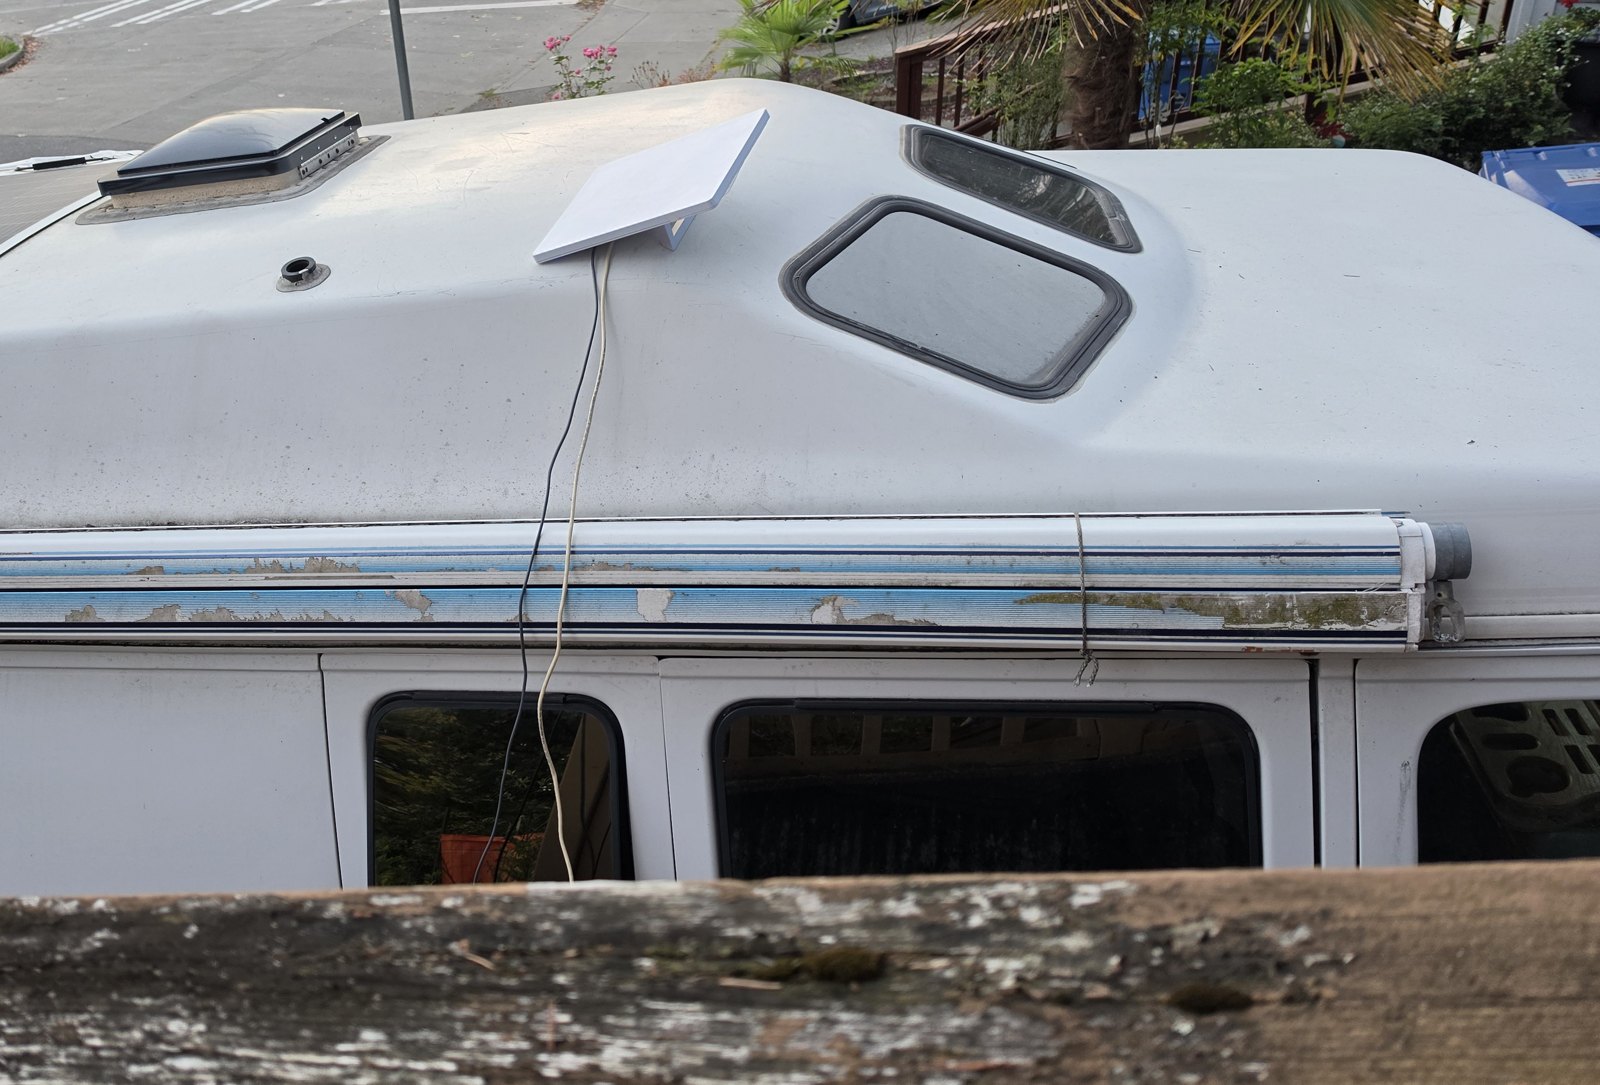
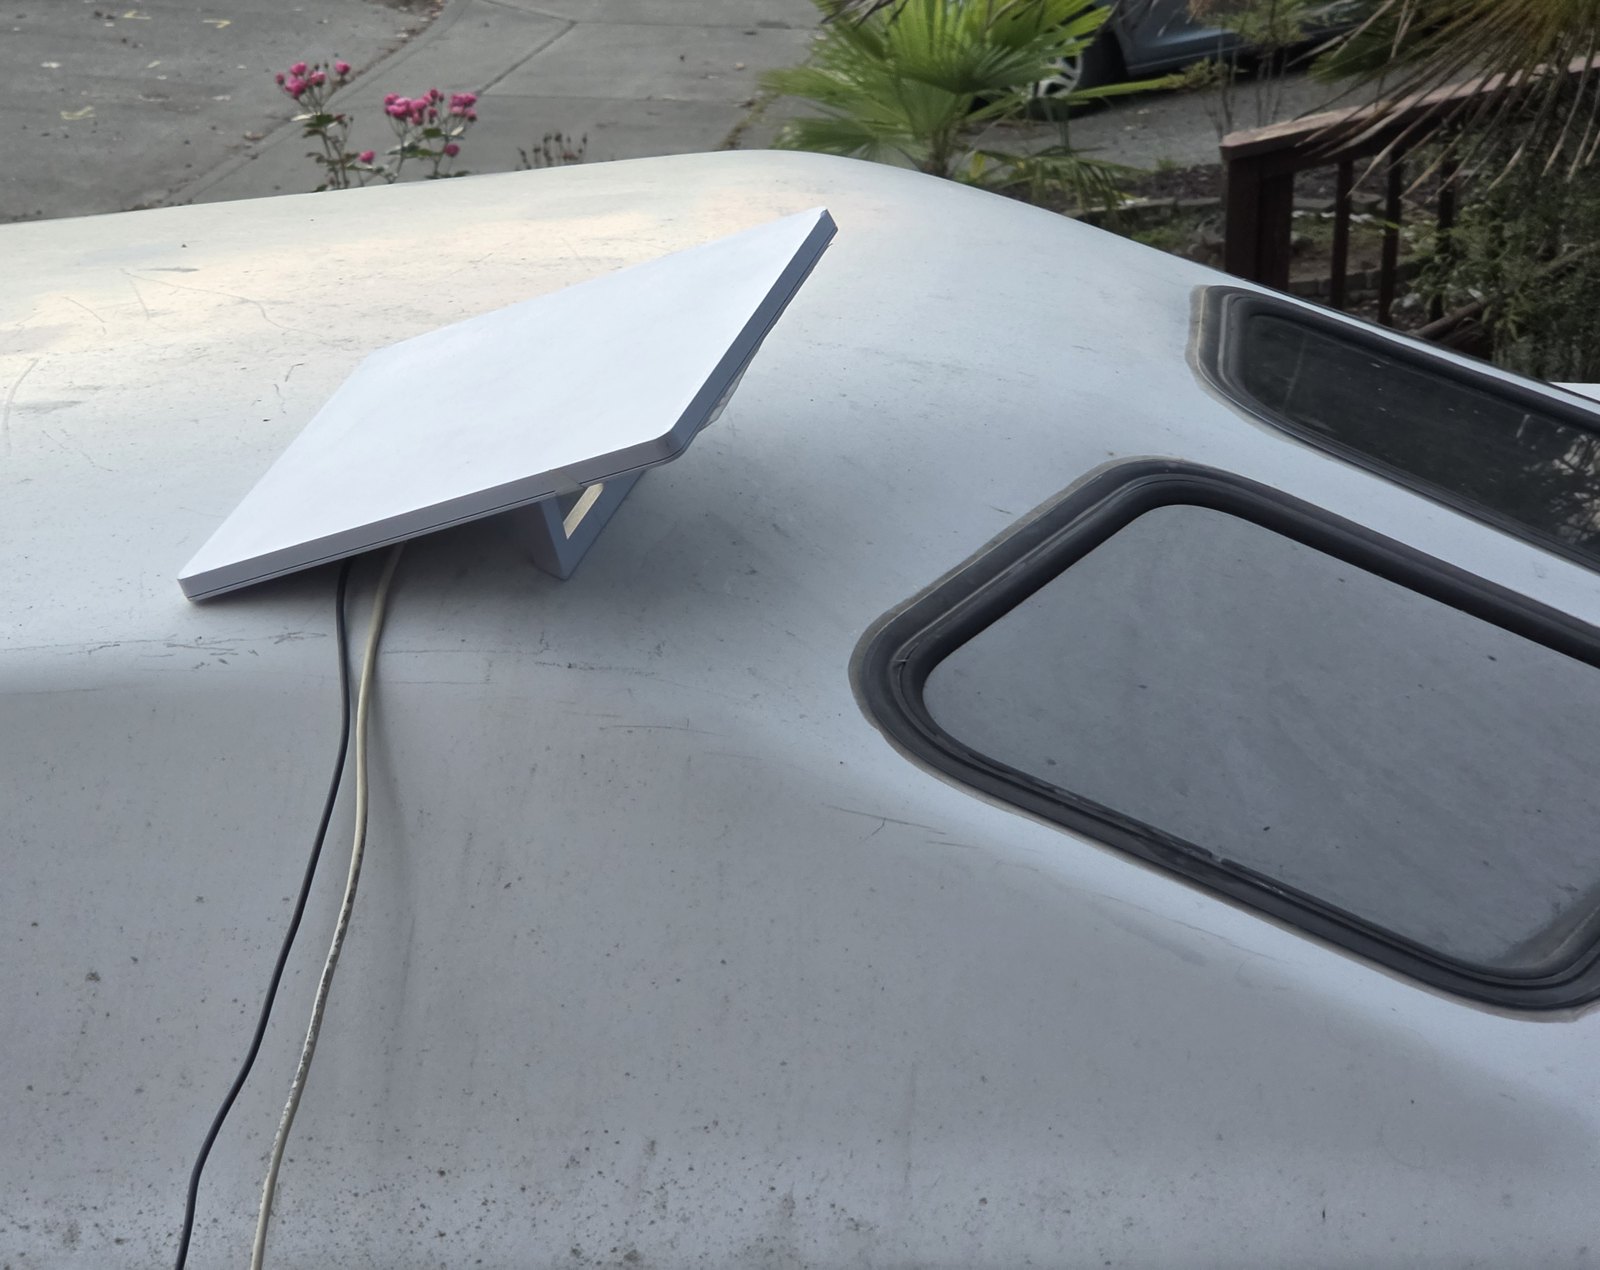
The Mini sat on the roof of my van, parked on a residential street in South Seattle. A tree and some houses are on one side and an open intersection is on the other. I ran the tests from a 2020 MacBook Pro with an Intel chip, inside the van. That makes this a city test, so don’t read the numbers as a rural result. It was also a single day, so treat them as what I saw that day.
A few terms before the results. A ping is a small test message sent to a server and back, and latency is how long that round trip takes, in milliseconds (ms). Lower is better. The median is the middle value, so half the pings were faster than it. The 95th percentile (p95) is the time that 95 out of 100 pings beat, which shows how slow the slow ones were. Packet loss is the share of pings that never came back.
Here are the five results I found most interesting. Every table and chart is in the full results at the bottom.
Dota 2 ping was 18 to 44 ms
I played a Dota 2 bot match in a private lobby on Ethernet (a cable from the laptop to the Mini, no Wi-Fi), from about 4:01 to 4:24 PM. The game shows a small network readout in the corner of the screen, and I took seven screenshots of it. Ping is the round trip from my laptop to the game server, in ms. Loss in / out is packet loss coming in and going out (the game doesn’t say what unit it uses). FPS is frames per second.
| Time | Ping (ms) | Loss in / out | FPS |
|---|---|---|---|
| 4:21:53 PM | 24 | 0 / 0 | 110 |
| 4:22:10 PM | 44 | 8 / 0 | 106 |
| 4:22:40 PM | 28 | 0 / 0 | 87 |
| 4:23:00 PM | 18 | 1 / 0 | 91 |
| 4:23:32 PM | 30 | 0 / 0 | 66 |
| 4:23:39 PM | 32 | 0 / 0 | 84 |
| 4:23:49 PM | 28 | 0 / 0 | 94 |
Ping ran from 18 to 44 ms with a median of 28 ms. Five of the seven showed 0 / 0 for packet loss.
While the match ran I also pinged Valve’s Seattle relay 10 times a second. A relay is a server on the list Valve publishes for Counter-Strike 2, and Dota 2 is also a Valve game. The median was 26.2 ms and the 95th percentile was 51.4 ms, meaning 95 out of 100 pings were faster than that. Loss was 0.33%, and 0.3% of pings took over 100 ms. The longest run of bad pings (lost, or over 100 ms) lasted 0.8 seconds. I can’t say that relay was one of the servers my match used.
A 33.2 GB download took 38 minutes
I installed Dota 2 over Starlink on Ethernet. Steam reported 33.2 GB (gigabytes of data), and the download took 38.2 minutes (2:53:43 to 3:31:56 PM). The average speed was 137.8 Mbps (megabits per second, the usual unit for internet speed) and the fastest second was 394 Mbps. The dish counted 39.5 GB down in that window, which includes everything on the Mini’s network.
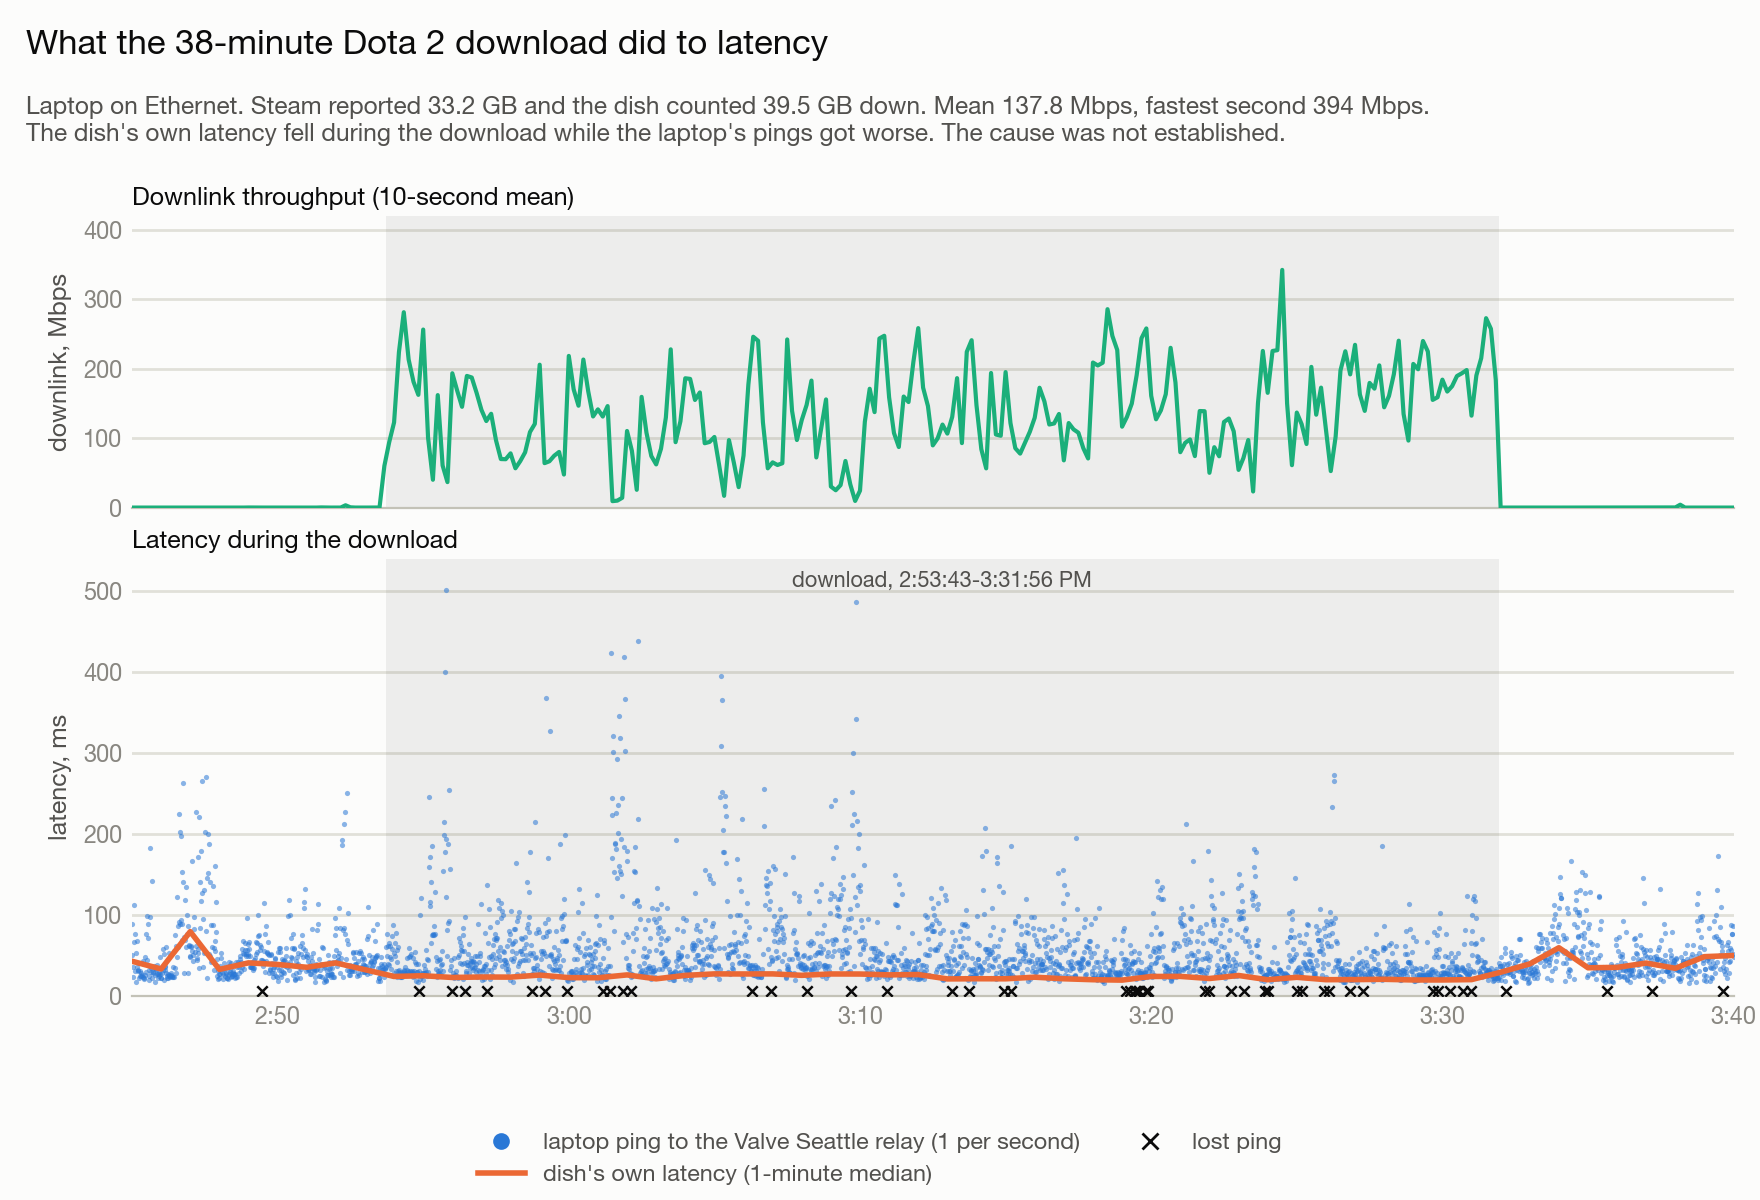
Latency got worse while the download ran, mostly for the slowest pings. The median to the Seattle relay went from 39.6 ms to 41.3 ms. The 95th percentile went from 103.8 to 149.5 ms, and loss went from 0.73% to 1.93%.
Wi-Fi vs Ethernet changed latency by about 3 ms
With the laptop about 1 m from the dish and its display off (that matters for Wi-Fi, see the full results), the two Wi-Fi bands, 2.4 GHz and 5 GHz, gave the same idle latency to Valve’s Seattle relay: a median of 42.1 and 41.9 ms. (Idle means nothing else was using the connection, and Ethernet is a cable instead of Wi-Fi.) Ethernet was 38.9 ms.
To see how much of that was my local connection, I also pinged the Mini’s own router, which only measures the leg between the laptop and the dish. That took 2.9 ms on 2.4 GHz, 3.1 ms on 5 GHz and 1.5 ms on Ethernet.
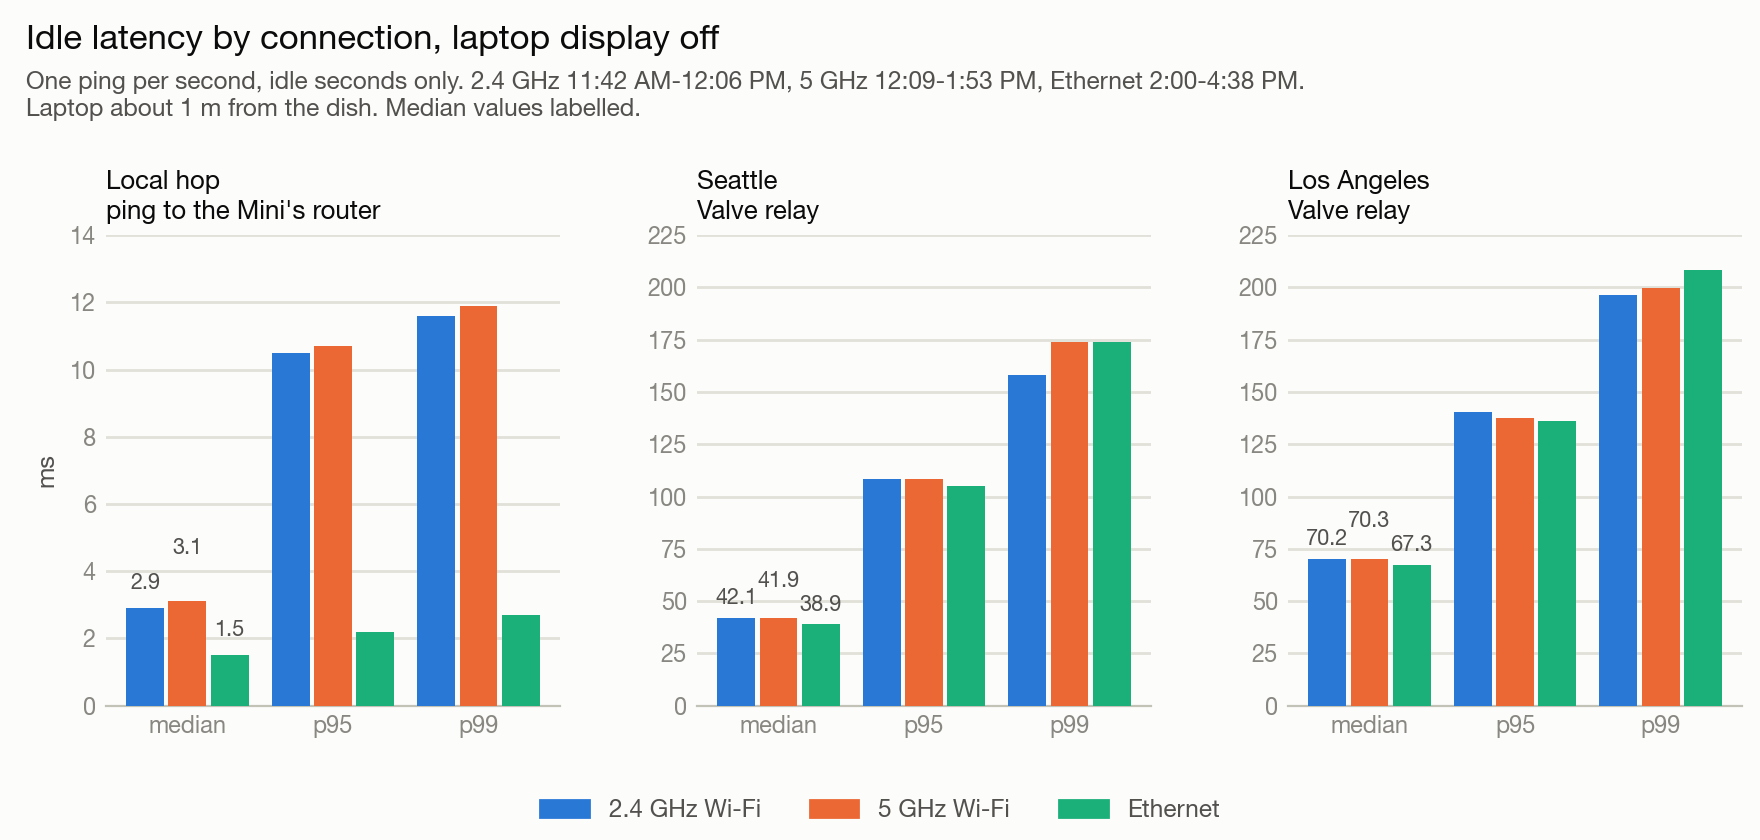
The dish also measures its own latency. It keeps pinging Starlink’s ground side (where Starlink’s network connects to the wider internet) and logs the round trip. That covers the trip over the satellite link, but not my laptop, my Wi-Fi or anything beyond Starlink, so it’s a shorter stretch of the path than my laptop’s pings, which go on to a Valve server in Seattle. In the 2 PM hour the dish’s number was 37.9 ms, within 2 ms of what my laptop saw to Seattle (39.6 ms). So nearly all of the latency to Seattle was the satellite link. This is latency only. I don’t have speed numbers I can compare across the three connections.
Latency was lower when the link was busy
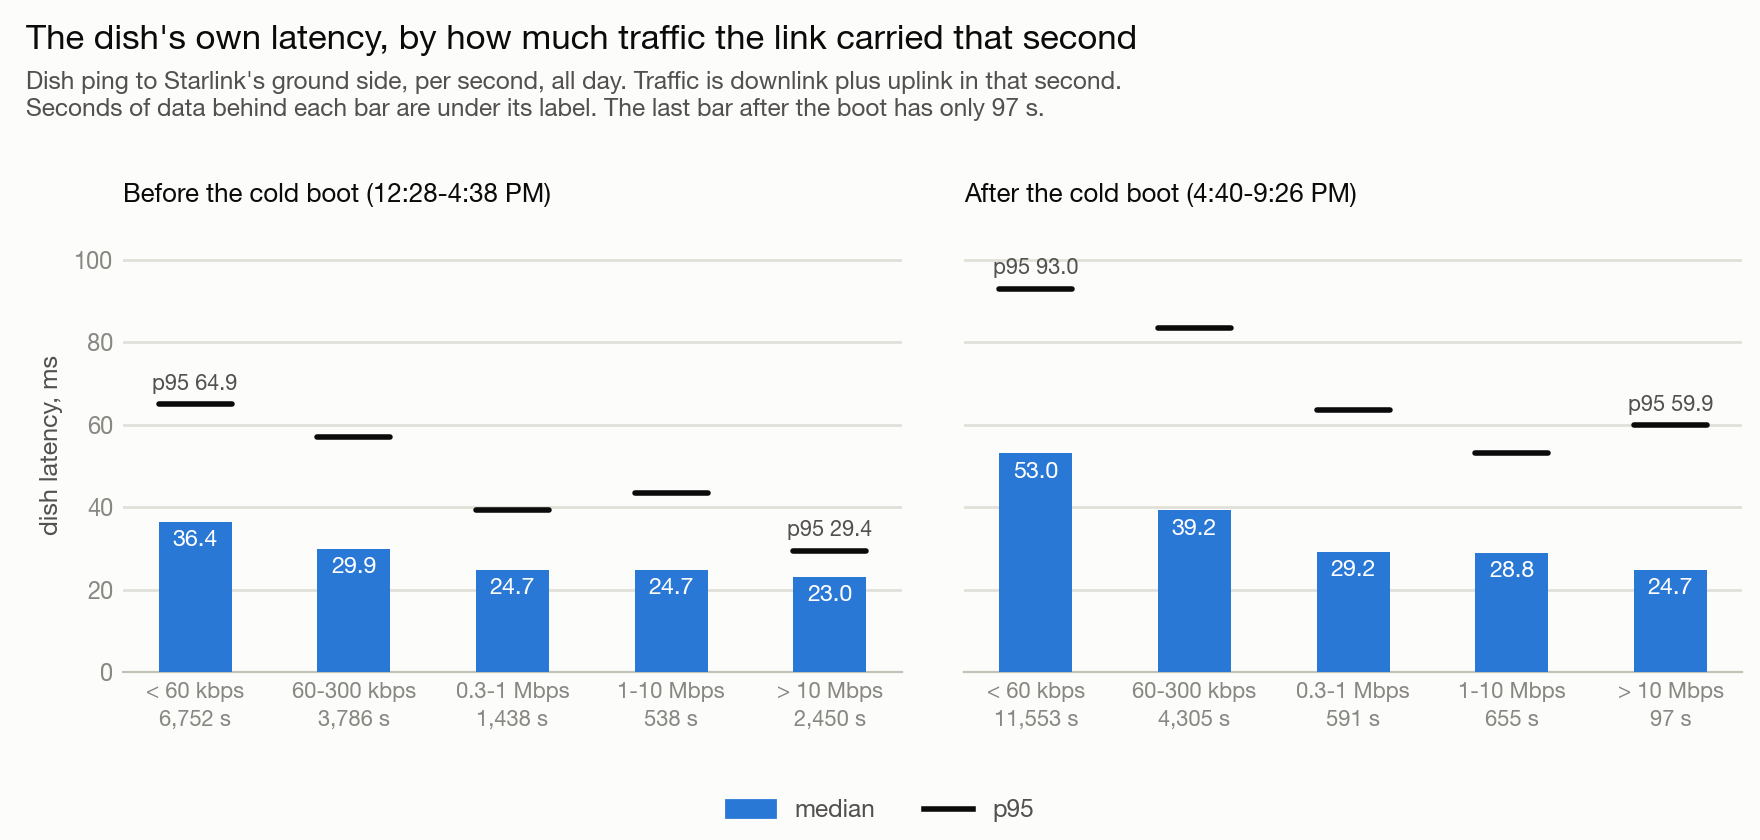
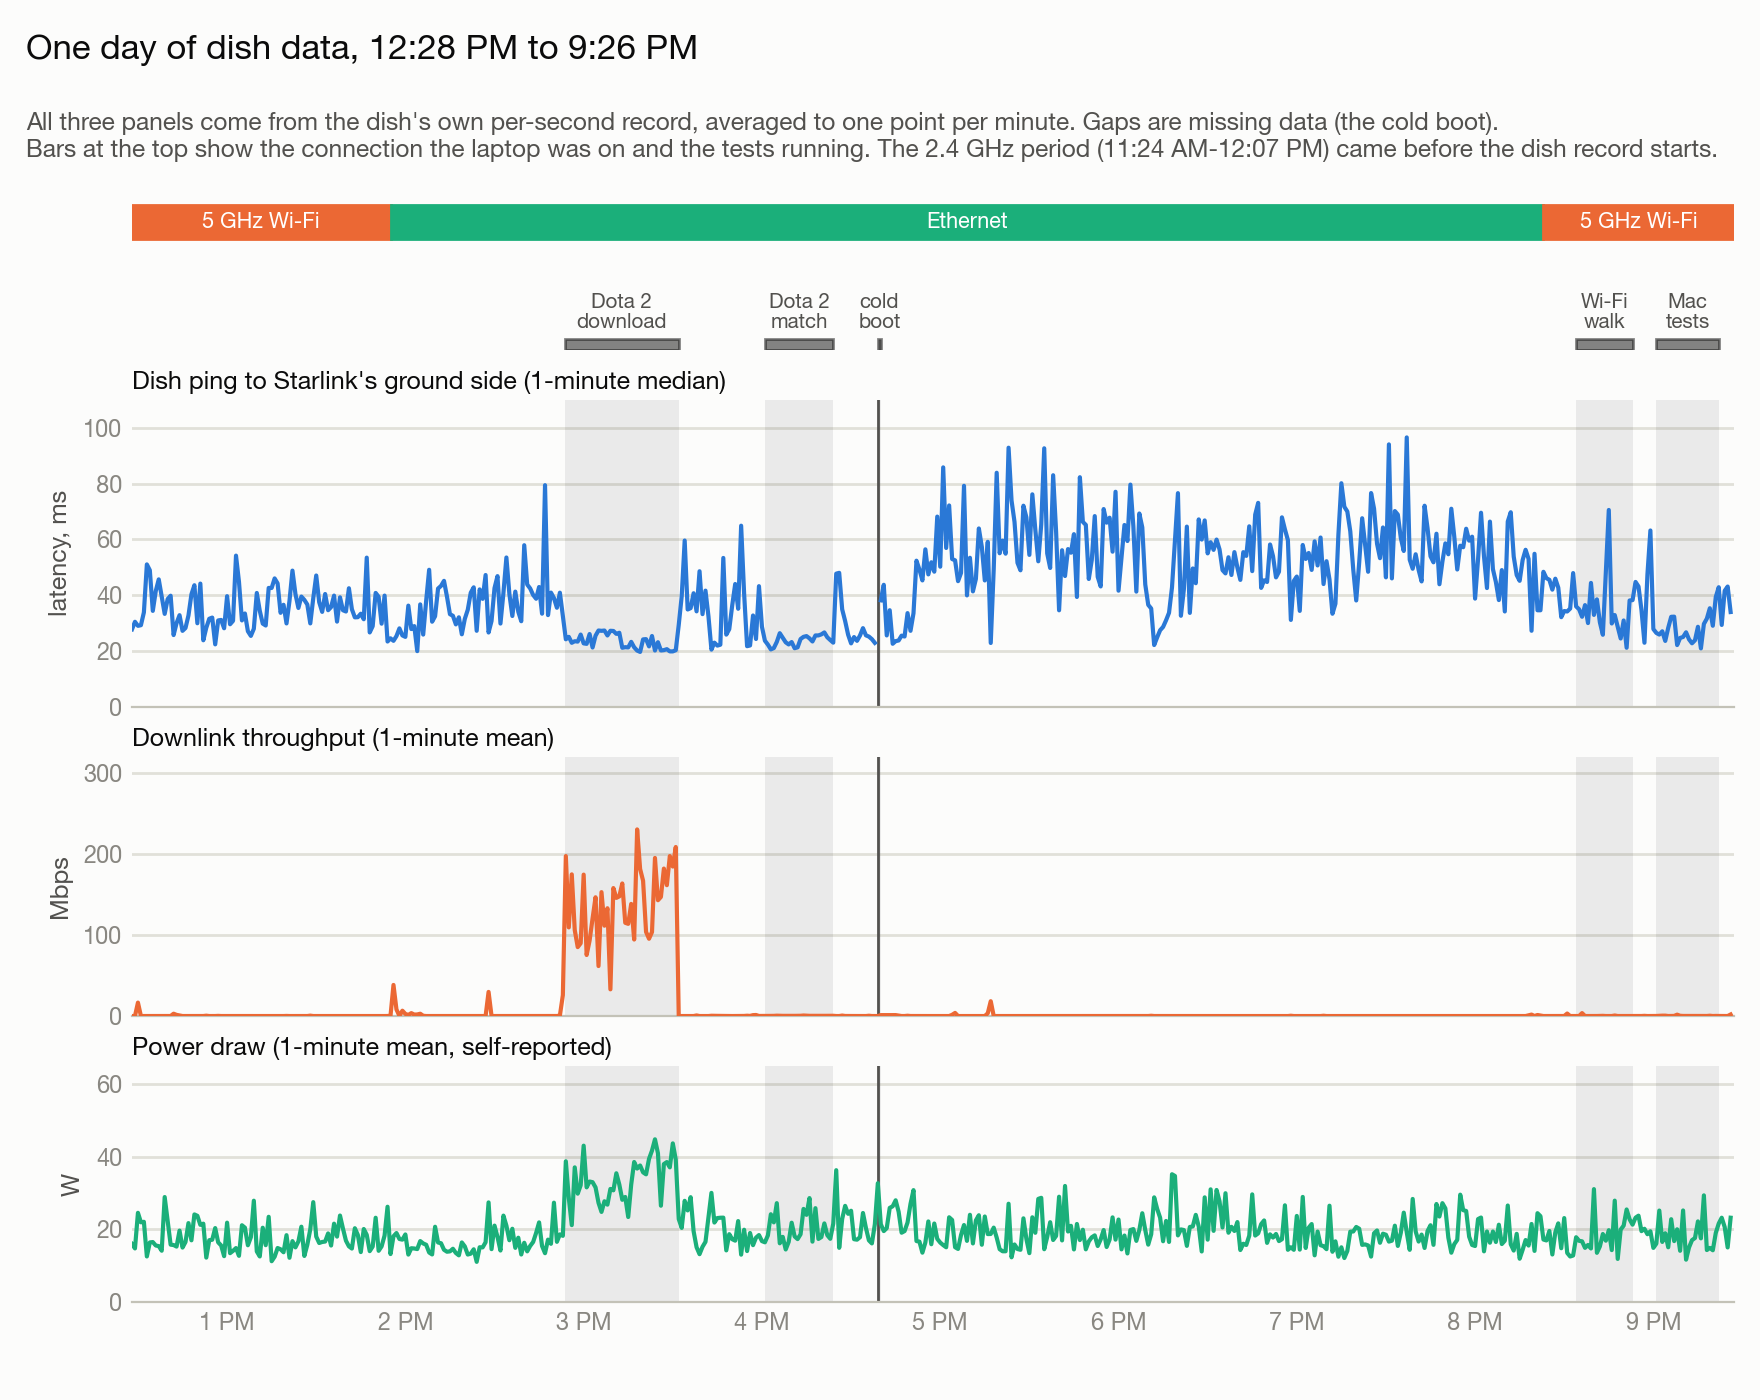
The dish’s own latency (the one I just described) was lower whenever the link carried traffic. By the link I mean the connection between the dish and Starlink. I split the day’s readings by how much data was moving in each second. Before the cold boot (I unplugged the dish and plugged it back in at 4:38 PM), the median was 36.4 ms in seconds with under 60 kbps flowing and 23.0 ms in seconds with over 10 Mbps. (kbps means thousands of bits per second and Mbps means millions.) Even 0.3 to 1 Mbps gave 24.7 ms.
My laptop’s pings showed the same thing in one half hour on Ethernet. The median to the Seattle relay was 31.1 ms during the Dota 2 match (with a 10-per-second ping test running alongside it) and 42.5 ms in the 140 seconds when nothing but one ping per second was running. The big download was the odd one out: the dish’s number fell during it, but my laptop’s pings got worse (see above). The two measurements cover different stretches of the path, so they can disagree. I don’t know why this happens.
Power draw: 19.9 W on average, 34.2 W during the download
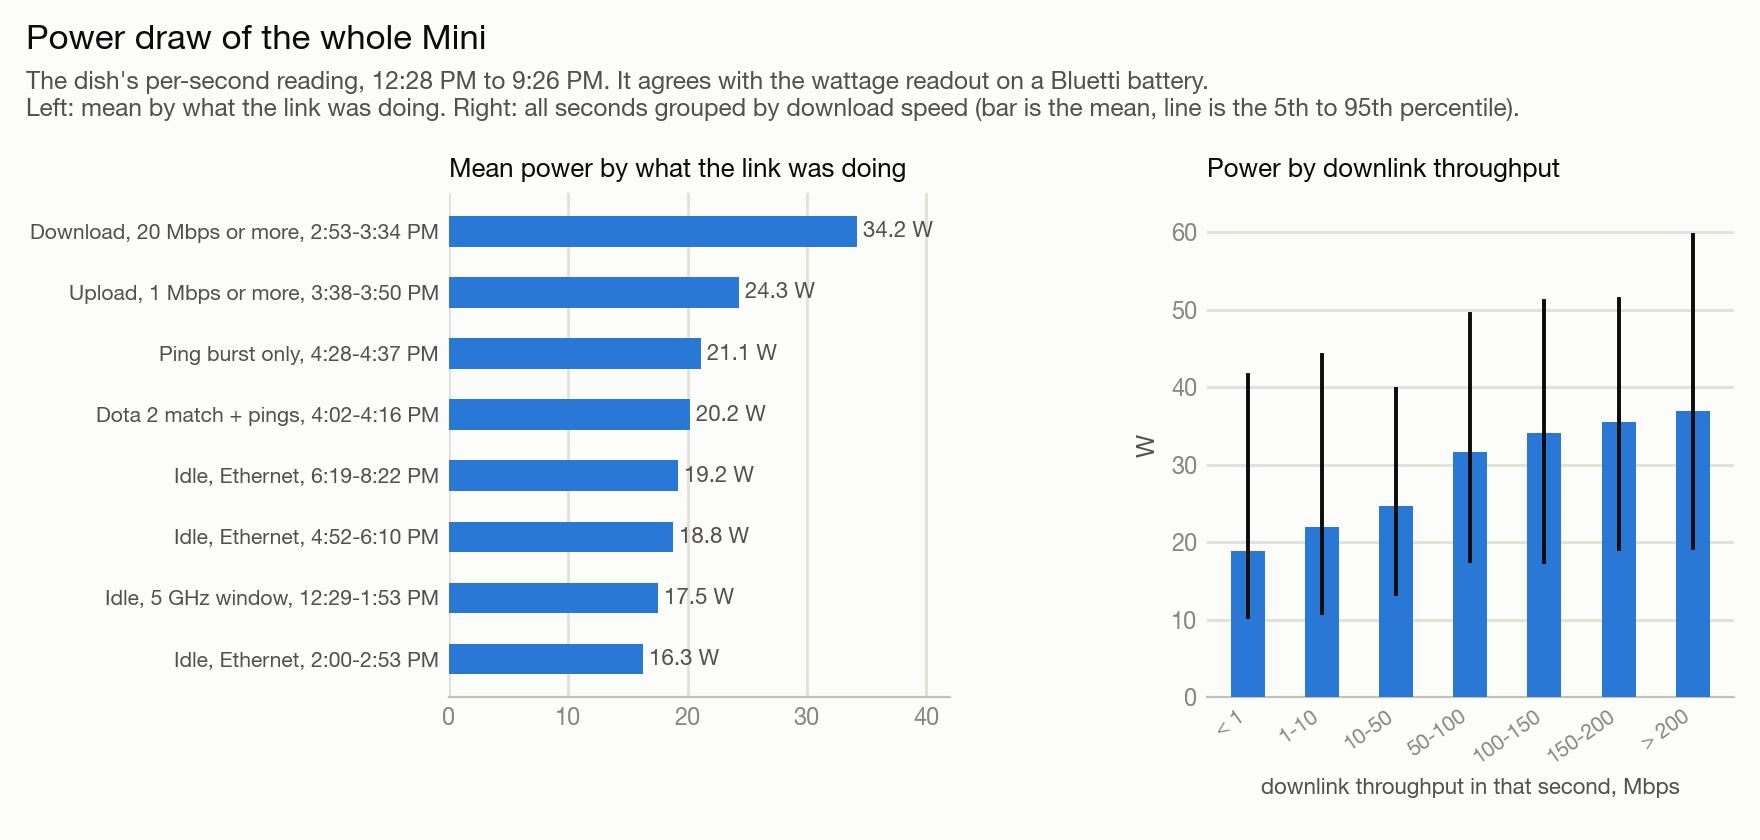
The dish reports its power draw every second. It’s the draw of the whole Mini, router included, and it agrees with the wattage readout on my Bluetti battery. Over about 9 hours the average was 19.9 W (watts). Idle was 16.3 to 19.2 W and the Dota 2 match was 20.2 W. The 38-minute download averaged 34.2 W.
We rent Bluetti batteries that can run a Mini for 30 to 50 hours. You can add one to a rental on the rental page. If you’re sizing a battery yourself, I’ve tested a few: the INIU 100W power bank and a comparison of the PeakDo LinkPower 2 and Orbynexa power stand. The math for turning watts into runtime is in my lithium battery post.
Full results
That’s the summary. You can stop reading here unless you want all the gory details. Everything below is the same data in full, with the other results I logged: the exact tables, more charts, and the details behind each number above.
Plain-English terms
- Ping and latency: a ping is a small test message sent to a server and back. Latency is how long that round trip takes, in milliseconds (ms). Lower is better.
- Median: the middle value. Half the pings were faster than this and half were slower.
- p95 and p99: the time that 95 (or 99) out of 100 pings beat. They show how slow the slow pings were, which the median hides.
- Max: the slowest single ping.
- Jitter: how much the time changes from one ping to the next (the average gap between neighboring replies). Low jitter means steady.
- Loss: pings that got no reply. “Ping success” is the opposite, the share that did.
- Over 100 ms: the share of pings that took longer than 100 ms. “Over 50 ms” works the same way.
- Link: the connection between the dish and Starlink. A busy link has data flowing over it, and an idle link doesn’t. The exact rule I used for idle is under “How I measured it”.
- The dish’s own latency vs my laptop’s: the dish keeps pinging Starlink’s ground side (where Starlink’s network connects to the wider internet) and logs the round trip. It doesn’t pass through the laptop or its connection. My laptop’s pings go farther, to a server like Valve’s relay in Seattle, so they also include the laptop-to-dish leg and everything beyond Starlink’s ground side. Both are round trips, but they measure different stretches of the path.
- Local hop: the ping to the Mini’s own router. It only measures the leg between the laptop and the dish, which is the part Wi-Fi or Ethernet changes.
- Valve relay: a server on the list Valve publishes for Counter-Strike 2. I pinged two, one in Seattle and one in Los Angeles.
- 2.4 GHz, 5 GHz and Ethernet: the two radio bands Wi-Fi can use, and a cable.
- kbps, Mbps, GB and W: thousands of bits per second, millions of bits per second, gigabytes of data, and watts of power.
- DNS: the lookup that turns a name like cascadialink.com into the number address a computer connects to. A resolver is the server that does the lookup. A repeat lookup asks for a name that was just asked for, a never-cached lookup asks for a made-up name nobody could have stored, and a first lookup is the first time a name is asked in a run.
- Carrier-grade NAT: many customers sharing one public internet address.
- Signal (dBm) and link rate: signal strength in dBm, where a number closer to zero is stronger (-51 is stronger than -79). Link rate is the speed the Wi-Fi radios agreed on, not a measured download speed.
- Obstruction map: the dish’s picture of which directions of sky it found blocked.
- Cold boot: unplugging the dish’s power and plugging it back in.
- Ping burst: pinging 10 times a second instead of once.
Results at a glance
- Latency to Valve’s Seattle relay, link in use: Median 26.2 to 31.2 ms, p95 51.4 to 67.5 ms, loss 0.23% to 0.42%, 0.2% to 1.6% of pings over 100 ms (Four bursts at 10 pings per second, 4:01 to 6:18 PM, Ethernet)
- In-game ping, Dota 2: 18 to 44 ms across seven screenshots, median 28 ms (4:21 to 4:23 PM, Ethernet)
- Latency to Valve’s Seattle relay, idle link, afternoon: Median 38.9 to 42.1 ms, p95 105 to 108 ms, jitter about 21 ms, loss 0.48% to 0.88% (1 ping per second, 11:42 AM to 4:38 PM, all three connection types)
- Same, evening after the cold boot: Median 55.7 ms, p95 164.9 ms, jitter 36.0 ms, loss 0.50% (1 ping per second, 4:52 to 8:22 PM, Ethernet)
- Local hop to the Mini’s router: Median 2.9 ms on 2.4 GHz, 3.1 ms on 5 GHz, 1.5 ms on Ethernet. p95 10.5, 10.7 and 2.2 ms (Laptop about 1 m from the dish, display off)
- Download speed: Mean 137.8 Mbps over 38 minutes, fastest second 394 Mbps (Dota 2 download, 2:53 to 3:32 PM, Ethernet)
- Upload speed: 6.3 and 6.5 Mbps (Two 15-second samples, 12:30 PM on 5 GHz and 2:28 PM on Ethernet)
- Latency while downloading at 138 Mbps: Seattle relay median 41.3 ms (39.6 idle), p95 149.5 ms (103.8 idle), loss 1.93% (0.73% idle) (1 ping per second, Ethernet)
- Dish power: Mean 19.9 W over 9 hours. About 16 to 19 W idle, 20 W during the game, 34 W during the download (Dish reading, matches a Bluetti battery’s wattage readout)
- Cold boot: 67 s without internet, of which about 48 s from power to passing traffic (One trial, warm dish)
- Dropouts: Apart from the cold boot, none longer than 2 s in 6 h 25 min (Ethernet, 1:56 to 8:22 PM)
- Mac display on versus asleep, Wi-Fi hop: 13% to 20% of pings over 50 ms with the display on, 0% with it asleep (5 GHz, about 1 m from the dish)
- Wi-Fi reach: Stayed on 5 GHz at every indoor stop and 23 m away across the street. Fell back to 2.4 GHz between 23 m and 50 m (Evening walk, loss figures not clean, see How far the Wi-Fi reaches)
What I tested on
- Dish: Starlink Mini with its built-in router, on its kickstand, loose on the fiberglass roof of the van. The dish reported its view obstructed (the share of its view of the sky that was blocked) between 0.45% and 1.26% over the day, and it was connected in every status sample where it answered.
- Laptop: a 2020 MacBook Pro with an Intel chip, running macOS 26.7, inside the van about 1 m below the dish, through the roof.
- Wi-Fi: 2.4 GHz was 802.11n on channel 6, 20 MHz wide. 5 GHz was 802.11ac, 80 MHz wide, on channel 48 (channel 40 after the cold boot). 11 other Wi-Fi radios were in range, 8 on 2.4 GHz and 3 on 5 GHz (one of those may have been the Mini’s own).
- Ethernet: a USB gigabit adapter linked at 1000 Mbps, with the laptop’s Wi-Fi off for every Ethernet test.
How I measured it
- Ping log: the laptop sent one ping per second to six targets for the whole session: two Valve relays (Seattle and Los Angeles, both from Valve’s published Counter-Strike 2 relay list), 1.1.1.1 and 8.8.8.8 (public servers run by Cloudflare and Google), and AWS endpoints in Oregon and N. California. A second log pinged only the Mini’s own router, which isolates the local hop.
- The dish’s own record: I pulled the dish’s own per-second record with the open-source starlink-grpc-tools project. That gives its latency and ping drop to Starlink’s ground side, plus throughput and power. None of it passes through the laptop.
- Idle: a second counts as idle when the dish saw under 1 Mbps down and under 0.5 Mbps up for that second and the 10 seconds either side, outside every test. For the Wi-Fi windows I also dropped seconds when the laptop display was on (more on that below).
Wi-Fi 2.4 GHz vs 5 GHz vs Ethernet
The laptop joined the Mini on 2.4 GHz the first time it connected (both bands share one network name). I switched Wi-Fi off and on at 12:07 PM and it rejoined on 5 GHz. The comparison below uses back-to-back windows, idle seconds only, with the laptop display off and the laptop about 1 m from the dish. All times are in milliseconds. The Ethernet window is the stretch before the cold boot.
Valve relay, Seattle
| Window | Median / p95 ms | Jitter ms | Loss |
|---|---|---|---|
| 2.4 GHz Wi-Fi, 11:42 AM-12:06 PM (1,470 pings) | 42.1 / 108.2 | 20.4 | 0.88% |
| 5 GHz Wi-Fi, 12:09-1:53 PM (5,011 pings) | 41.9 / 108.2 | 21.2 | 0.48% |
| Ethernet, 2:00-4:38 PM (4,124 pings) | 38.9 / 105.1 | 20.8 | 0.63% |
Local hop (ping to the Mini’s router)
| Window | Median / p95 ms | Jitter ms | Loss |
|---|---|---|---|
| 2.4 GHz Wi-Fi, 11:42 AM-12:06 PM (1,470 pings) | 2.9 / 10.5 | 1.8 | 0.00% |
| 5 GHz Wi-Fi, 12:09-1:53 PM (5,011 pings) | 3.1 / 10.7 | 1.9 | 0.00% |
| Ethernet, 2:00-4:38 PM (4,124 pings) | 1.5 / 2.2 | 0.3 | 0.00% |
The Los Angeles relay sits about 28 ms above Seattle at the median on all three (70.2 minus 42.1, 70.3 minus 41.9, 67.3 minus 38.9). The windows ran back to back, so each connection got a different stretch of the day.
Speed
The two valid short speed runs are 15-second tests against one Cloudflare endpoint, with four downloads or uploads running at once, and they are two hours apart on different connections. So they can’t be compared. They don’t show that Ethernet is faster than 5 GHz, and there’s no valid 2.4 GHz sample.
| Run and phase | Median / p95 ms | Mbps down | Mbps up |
|---|---|---|---|
| 12:30 PM, 5 GHz, idle (74 pings) | 33.7 / 97.8 | – | – |
| 12:30 PM, 5 GHz, download (74 pings) | 31.3 / 48.8 | 62.1 | 0.8 |
| 12:30 PM, 5 GHz, upload (75 pings) | 33.3 / 64.2 | 0.2 | 6.3 |
| 2:27 PM, Ethernet, idle (74 pings) | 30.9 / 69.0 | – | – |
| 2:27 PM, Ethernet, download (79 pings) | 34.0 / 51.9 | 105.2 | 1.3 |
| 2:27 PM, Ethernet, upload (75 pings) | 33.4 / 75.8 | 0.2 | 6.5 |
The laptop display changes the Wi-Fi numbers
Every clean Wi-Fi number in this post was taken with the laptop display off. With the display on, the Mac runs its peer-to-peer radio (the one AirDrop, AirPlay and Handoff use, interface awdl0), and that radio takes the Wi-Fi chip off the router’s channel on a schedule. Pings wait while it’s gone.
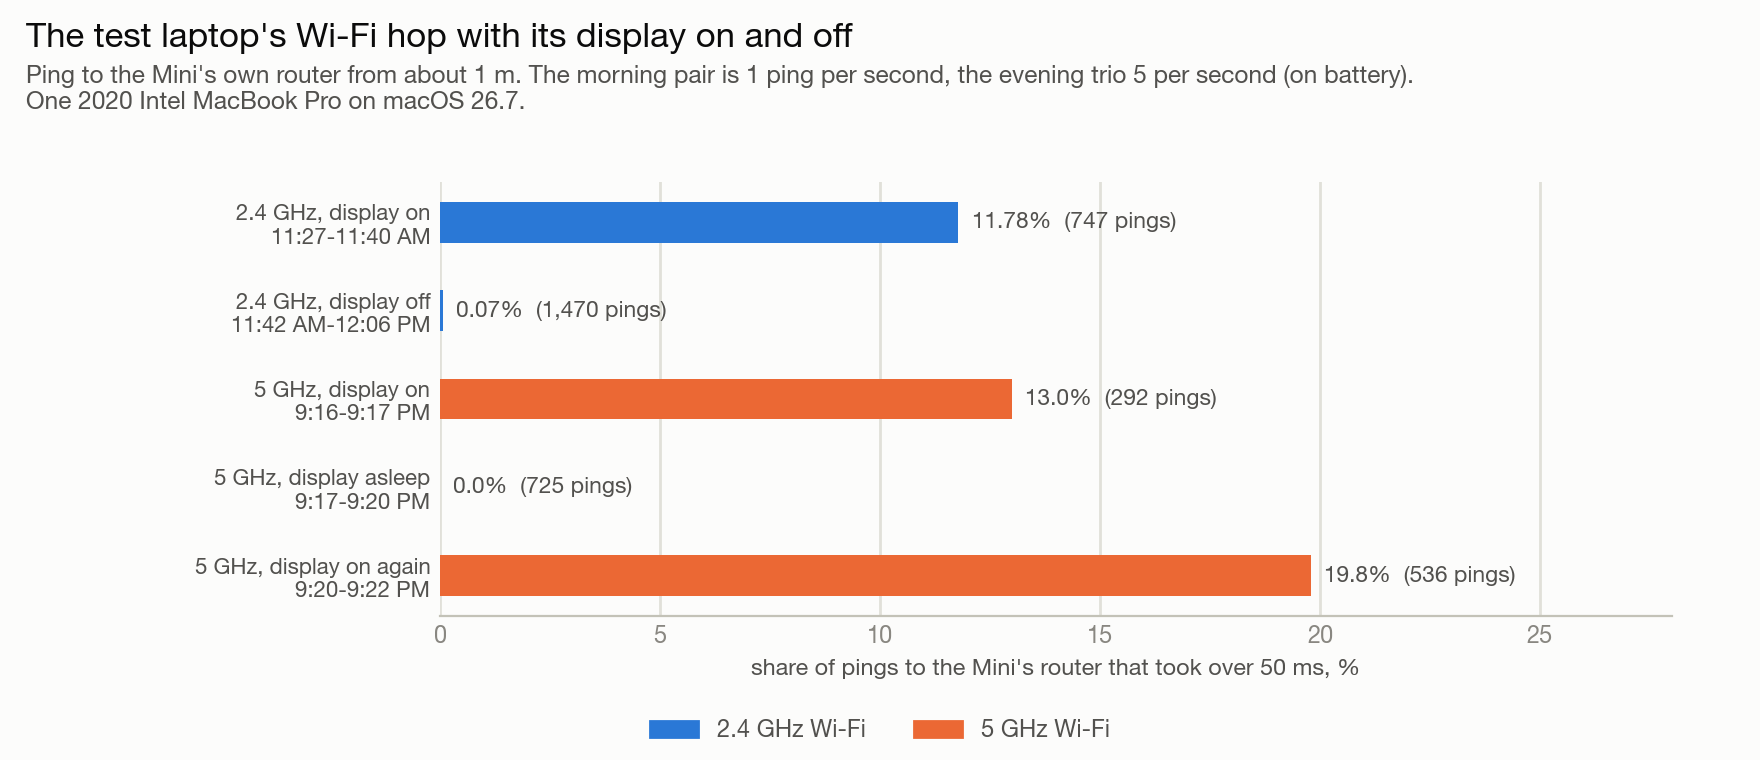
| Condition (pings to the Mini’s router) | Median / p95 ms | Over 50 ms |
|---|---|---|
| 2.4 GHz, display on, 11:27-11:40 AM (747 pings) | 5.3 / 82.1 | 11.78% |
| 2.4 GHz, display off, 11:42 AM-12:06 PM (1,470 pings) | 2.9 / 10.5 | 0.07% |
| 5 GHz, display on, 9:16-9:17 PM (292 pings) | 2.4 / 78.6 | 13.0% |
| 5 GHz, display asleep, 9:17-9:20 PM (725 pings) | 2.6 / 5.1 | 0.0% |
| 5 GHz, display on again, 9:20-9:22 PM (536 pings) | 3.5 / 81.2 | 19.8% |
| 5 GHz, Wi-Fi settings page open, 9:01 PM (500 pings) | 3.6 / 199.5 | 29.0% |
| 5 GHz, System Settings closed, 9:05 PM (500 pings) | 2.3 / 76.8 | 13.2% |
On 5 GHz at about 1 m, 13.0% of pings to the router took over 50 ms with the display on, 0.0% with it asleep, and 19.8% when it woke again. The morning log on 2.4 GHz showed the same thing: 11.78% with the display on and 0.07% after it went dark. The system log has the peer-to-peer radio active at a 22% and then a 34% duty cycle (the share of time it was running) with the display on, and idle once the display slept. The evening test ran on battery and the display-asleep phase was the cleanest Wi-Fi reading of the day, so battery wasn’t the cause.
Leaving the Wi-Fi page of System Settings open made it worse. macOS scanned continuously (a 2-second scan and a 7 to 8-second scan, repeating every 20 seconds, with 84 scan requests in one minute), and 29.0% of pings went over 50 ms against 13.2% with System Settings closed.
Ethernet tests weren’t affected, since Wi-Fi was off for all of them, including Dota 2. This is one 2020 MacBook Pro with an Intel chip, on macOS 26.7 with my sharing settings, so I can’t say whether other devices do the same.
Idle link vs link in use
The link’s latency was lower and steadier whenever it carried steady traffic, even a small amount. I don’t have an explanation for it. These are the dish’s own readings, grouped by how much data was moving in each second.
Before the cold boot, 12:28-4:38 PM
| Traffic in that second | Seconds | Median / p95 ms | Ping drop |
|---|---|---|---|
| Under 60 kbps | 6,752 | 36.4 / 64.9 | 0.61% |
| 60-300 kbps | 3,786 | 29.9 / 57.1 | 0.43% |
| 0.3-1 Mbps | 1,438 | 24.7 / 39.2 | 0.24% |
| 1-10 Mbps | 538 | 24.7 / 43.3 | 0.29% |
| Over 10 Mbps | 2,450 | 23.0 / 29.4 | 0.42% |
After the cold boot, 4:40-9:26 PM
| Traffic in that second | Seconds | Median / p95 ms | Ping drop |
|---|---|---|---|
| Under 60 kbps | 11,553 | 53.0 / 93.0 | 0.34% |
| 60-300 kbps | 4,305 | 39.2 / 83.4 | 0.23% |
| 0.3-1 Mbps | 591 | 29.2 / 63.5 | 0.29% |
| 1-10 Mbps | 655 | 28.8 / 53.2 | 0.22% |
| Over 10 Mbps | 97 | 24.7 / 59.9 | 0.55% |
Before the cold boot the median was 36.4 ms with under 60 kbps flowing and 23.0 ms with over 10 Mbps (36.4 minus 23.0 is 13.4 ms). After the cold boot the same two rows were 53.0 and 24.7 ms, but the last row has only 97 seconds in it, so go easy on that one.
The same pattern shows up in one half hour on Ethernet, 4:02 to 4:37 PM, before the cold boot. The dish’s median was 23.0 ms during the Dota 2 match with the ping burst running, 25.2 ms during the match alone and 25.4 ms with only the ping burst. In the 140 seconds with nothing but one ping per second it was 44.8 ms. That idle stretch is short.
| State (dish seconds, laptop pings) | Dish median / p95 ms | Laptop median / p95 ms |
|---|---|---|
| Dota 2 match plus 10/s pings, 4:02:00-4:17:00 (900 s, 897 pings) | 23.0 / 30.7 | 31.1 / 59.5 |
| Dota 2 match only, 4:17:30-4:24:30 (420 s, 418 pings) | 25.2 / 28.5 | 33.9 / 55.4 |
| Nothing but 1 ping per second, 4:25:00-4:27:20 (140 s, 139 pings) | 44.8 / 74.5 | 42.5 / 123.3 |
| 10/s pings only, 4:28:00-4:37:30 (570 s, 568 pings) | 25.4 / 34.0 | 31.6 / 56.6 |
The dish’s idle median was 35.9 ms (p95 61.8) from 12:29 to 1:53 PM and 37.9 ms (p95 70.9) from 2:00 to 2:53 PM.
The 38-minute download
I installed Dota 2 over Starlink with the laptop on Ethernet, from 2:53:43 to 3:31:56 PM (38.2 minutes). The download averaged 137.8 Mbps (median 131.1, 5th percentile 18.6, 95th percentile 277.4), and the fastest second was 394 Mbps. 122 seconds inside the window were under 20 Mbps.
Steam reported 33.2 GB, completed at 3:32 PM, with a peak of 276.9 Mbps. (Steam’s store page lists a 60 GB storage requirement, which is more than what came down.) The dish counted 39.5 GB down and 1.32 GB up in that window. That covers everything on the Mini’s network, plus protocol overhead, and Steam’s GB may be decimal or binary, so the two counts aren’t exactly comparable. Over the whole record the dish counted 41.1 GB down and 1.79 GB up. If you’re sizing a plan around streaming instead of downloads, my streaming calculator does that math.
Latency from the laptop got worse while the download ran. To the Seattle relay the median went from 39.6 ms idle to 41.3 ms, p95 from 103.8 to 149.5 ms, and loss from 0.73% to 1.93%. The ping to the Mini’s router didn’t move (1.5 ms idle median, 1.3 ms during), so the extra delay is past the router. The other targets moved the same way.
In this table, Seattle and Los Angeles are the Valve relays, and idle means the 2:00 to 2:53 PM stretch before the download.
| Target and state | Median / p95 ms | Jitter ms | Loss |
|---|---|---|---|
| Seattle, idle 2:00-2:53 PM (2,479 pings) | 39.6 / 103.8 | 21.3 | 0.73% |
| Seattle, during download (2,279 pings) | 41.3 / 149.5 | 28.7 | 1.93% |
| Los Angeles, idle 2:00-2:53 PM (2,478 pings) | 68.5 / 135.3 | 22.3 | 0.40% |
| Los Angeles, during download (2,279 pings) | 70.1 / 176.1 | 29.3 | 2.94% |
| 1.1.1.1, idle 2:00-2:53 PM (2,479 pings) | 39.6 / 106.8 | 21.5 | 0.65% |
| 1.1.1.1, during download (2,279 pings) | 41.9 / 153.1 | 29.2 | 2.33% |
| AWS Oregon, idle 2:00-2:53 PM (2,478 pings) | 46.6 / 112.3 | 21.3 | 0.52% |
| AWS Oregon, during download (2,279 pings) | 48.9 / 161.7 | 29.9 | 3.20% |
| Mini’s router, idle 2:00-2:53 PM (2,479 pings) | 1.5 / 2.2 | 0.4 | 0.00% |
| Mini’s router, during download (2,279 pings) | 1.3 / 2.0 | 0.4 | 0.00% |
One open question. The dish’s own latency was lower during the download (22.6 ms median, p95 28.0) than when idle (37.9 ms median from 2:00 to 2:53 PM), while the laptop’s pings got worse. The dish’s number covers a shorter stretch of the path than the laptop’s. I don’t know why they disagree.
Dota 2 in full
I played a Dota 2 bot match in a private lobby from about 4:01 to 4:24 PM, with the laptop on Ethernet. I picked a US West server, and the match ran on it. The game ran at 66 to 110 FPS, and the dish recorded about 0.3 Mbps down and 0.1 to 0.25 Mbps up during the match, which includes my test pings. The seven in-game ping readings are in the table near the top of the page.
During the match I pinged the two Valve relays 10 times per second. To the Seattle relay the median was 26.2 ms, p95 51.4 ms, p99 75.3 ms and the max 263 ms, with loss of 0.33% and 0.3% of pings over 100 ms. The longest bad episode (a run of pings that were lost or took over 100 ms) was 0.8 s. The Los Angeles relay had a median of 55.1 ms. The dish’s own median latency during the match was 22.8 ms (p95 30.9) and its power draw averaged 20.2 W.
The dish’s number runs lower than the in-game ping (median 28 ms). It covers a shorter stretch of the path, since the game’s ping runs from my laptop, through the Mini and Starlink, to the game server and back.
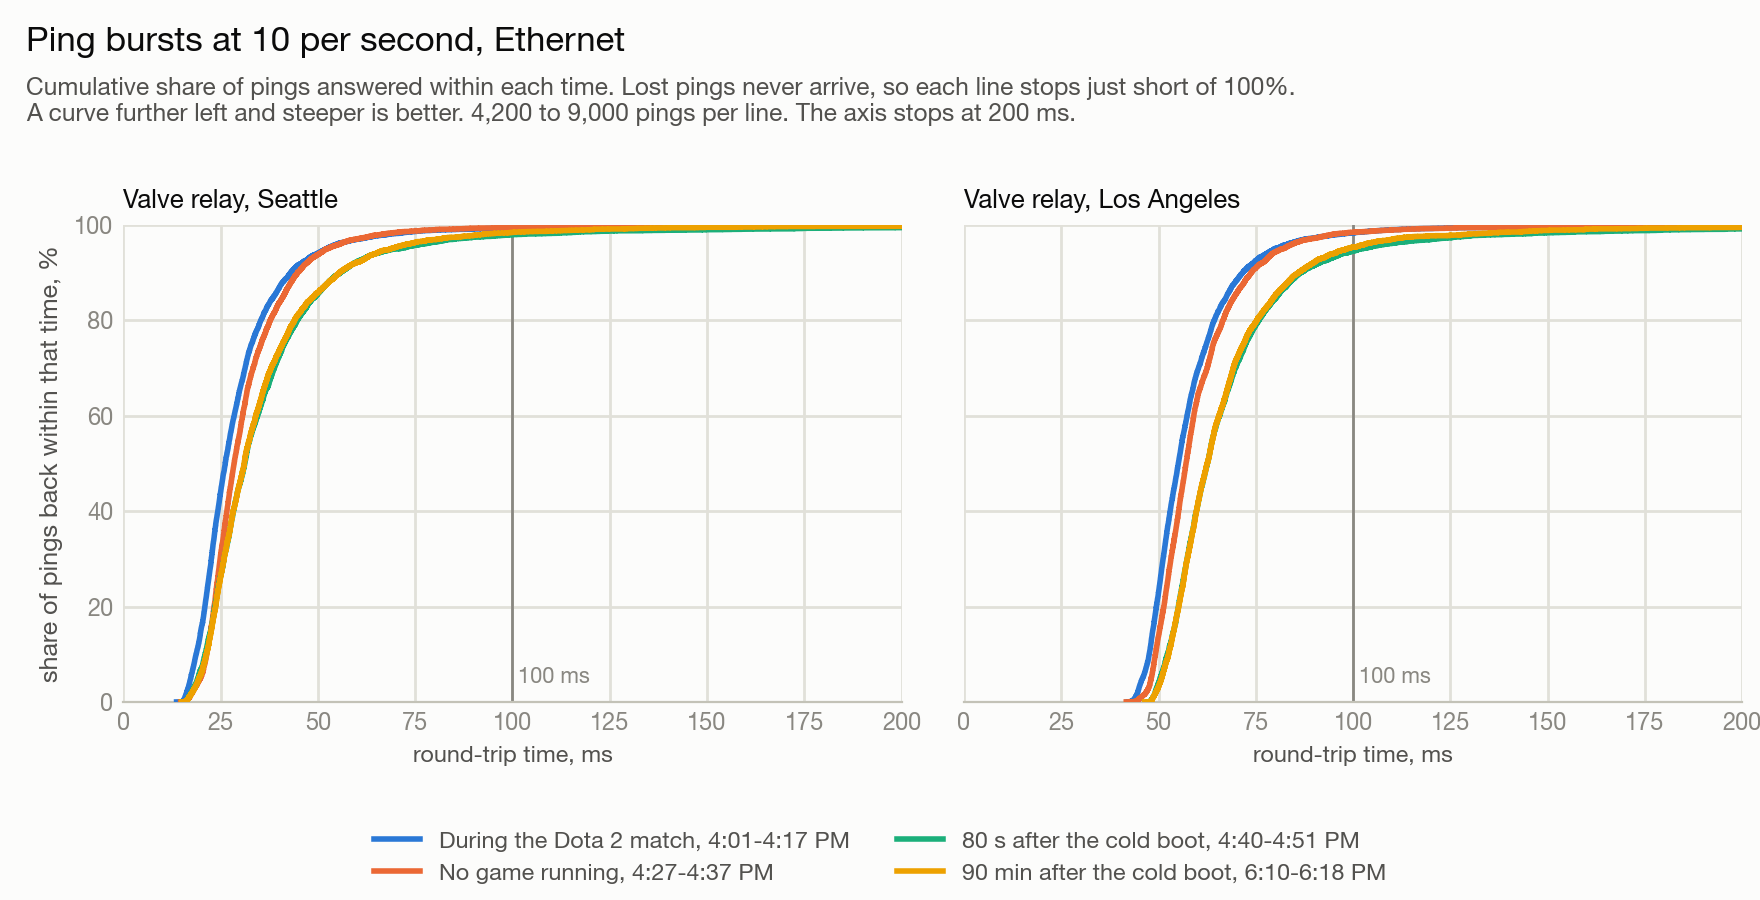
Valve Seattle relay
| Burst | Median / p95 ms | Loss | Over 100 ms |
|---|---|---|---|
| During Dota 2 match, 4:01-4:17 PM (9,000 pings) | 26.2 / 51.4 | 0.33% | 0.3% |
| No game, 4:27-4:37 PM (6,000 pings) | 28.5 / 51.7 | 0.23% | 0.2% |
| 80 s after cold boot, 4:40-4:51 PM (6,000 pings) | 31.2 / 67.5 | 0.42% | 1.6% |
| 90 min after cold boot, 6:10-6:18 PM (4,200 pings) | 31.1 / 67.2 | 0.26% | 1.3% |
Valve Los Angeles relay
| Burst | Median / p95 ms | Loss | Over 100 ms |
|---|---|---|---|
| During Dota 2 match, 4:01-4:17 PM (9,000 pings) | 55.1 / 79.4 | 0.27% | 1.4% |
| No game, 4:27-4:37 PM (6,000 pings) | 57.0 / 81.0 | 0.28% | 1.2% |
| 80 s after cold boot, 4:40-4:51 PM (6,000 pings) | 62.5 / 99.7 | 0.53% | 4.9% |
| 90 min after cold boot, 6:10-6:18 PM (4,200 pings) | 62.4 / 96.8 | 0.40% | 4.2% |
Jitter at 10 pings per second isn’t comparable with jitter at 1 per second, because pings a tenth of a second apart differ less than pings a second apart. This was one short bot match on Ethernet.
Afternoon vs evening, and a cold boot
Idle latency was higher from 4:52 PM on. On Ethernet the Seattle relay’s idle median went from 38.9 ms (2:00 to 4:38 PM) to 55.7 ms (4:52 to 8:22 PM). That’s 55.7 minus 38.9, or 16.8 ms. The p95 went from 105.1 to 164.9 ms and jitter from 20.8 to 36.0 ms. The dish’s own record shows the same step.
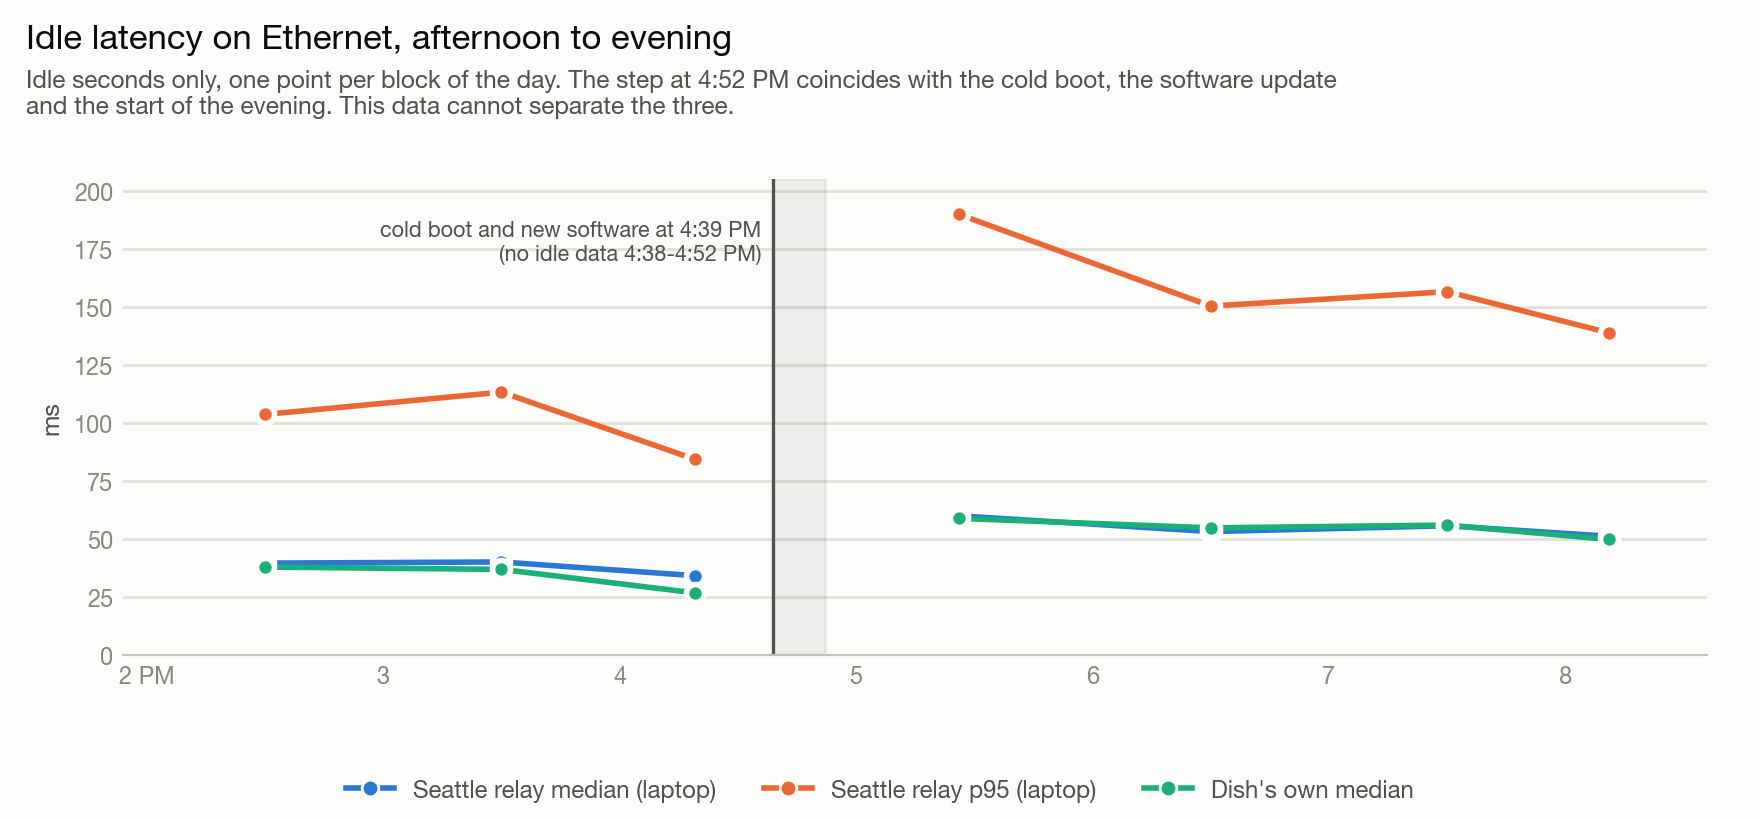
| Hour (idle seconds only) | Laptop median / p95 ms | Dish median / p95 ms |
|---|---|---|
| 2:00-3:00 PM (2,480 pings) | 39.6 / 103.7 | 37.9 / 70.9 |
| 3:00-4:00 PM (1,177 pings) | 40.1 / 113.3 | 36.9 / 68.3 |
| 4:00-4:38 PM (467 pings) | 34.2 / 84.4 | 26.8 / 62.9 |
| 4:52-6:00 PM (3,845 pings) | 60.0 / 190.0 | 58.9 / 100.7 |
| 6:00-7:00 PM (3,002 pings) | 53.2 / 150.4 | 54.8 / 86.0 |
| 7:00-8:00 PM (3,556 pings) | 55.7 / 156.6 | 56.0 / 94.8 |
| 8:00-8:22 PM (1,177 pings) | 51.2 / 138.9 | 49.8 / 82.2 |
Three things changed at about the same time: the cold boot at 4:38:59 PM, the software update the reboot applied (2026.09.18.mr87170.1 to 2026.09.24.mr87636.3), and the start of the evening. This data can’t separate them.
With the link in use, latency rose much less across the same boundary. The dish’s median in use was 21 to 25 ms before the cold boot and 27 to 29 ms after, against 36 to 38 ms idle before and 54 to 59 ms idle after. The ping bursts after the reboot were nearly identical 80 seconds and 90 minutes after it, so dish warm-up doesn’t explain why they were worse than the two before it. During the 4:40 PM burst the dish was also fetching and writing the update (fetching from 4:40 to 4:46 PM, writing at 4:46, idle from 4:47).
The cold boot
I pulled the dish’s power at 4:38:59 PM and plugged it back in. The laptop saw 67 seconds without internet (66 lost pings at one per second). By the dish’s uptime counter it powered on at about 4:39:18 PM, and traffic was passing about 48 seconds after that. The dish had been in place for 5 hours 17 minutes, so this was a warm restart at a known location.
| Event | Time |
|---|---|
| Last ping reply before power was pulled | 4:38:59 PM |
| Router and internet both answering again | 4:40:06 PM |
| Outage seen from the laptop | 67 s (66 lost pings at one per second) |
| Dish power-on, from its uptime counter | about 4:39:18 PM |
| Power-on to passing traffic | about 48 s |
| Before, 4:38 PM | After, 4:40 PM | |
|---|---|---|
| Software | 2026.09.18.mr87170.1 | 2026.09.24.mr87636.3 |
| Software update state | Reboot required | Fetching until 4:46 PM, writing, then idle from 4:47 PM |
| “Install pending” alert | On | Off |
| “Obstruction map reset” alert | On | Off |
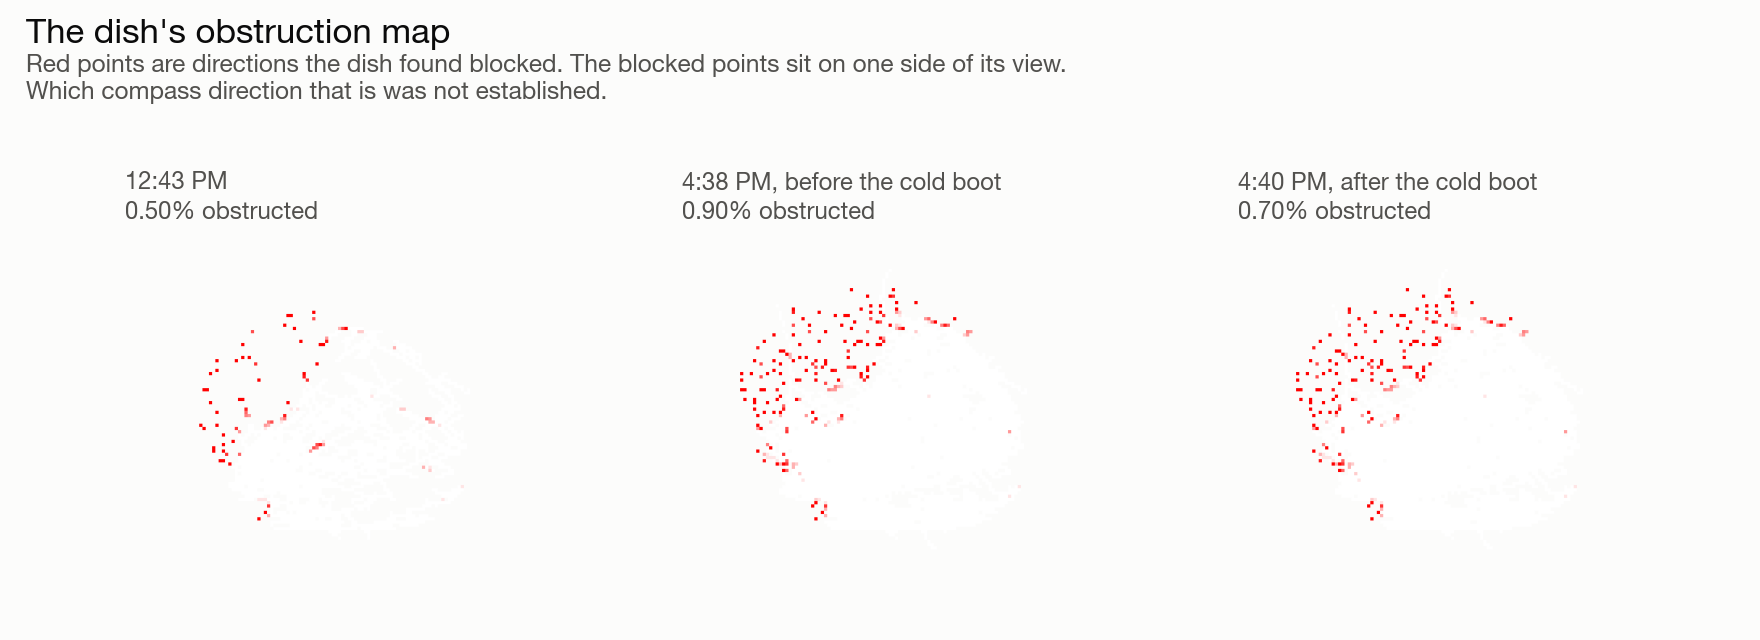
| Fraction obstructed | 0.90% | 0.70% |
| Obstruction map image | Same pattern of blocked points as before |
Dropouts
This covers Ethernet from 1:56 to 8:22 PM with every condition included, the download and the bursts among them. I logged 23,106 seconds across six targets. Apart from the 66-second cold boot, there were 47 seconds in which at least five of the six targets got no reply. They came as 45 single seconds and one two-second event at 5:09:09 PM.
To the Seattle relay over the same period, with the cold boot excluded, I sent 22,911 pings and 148 got no reply (0.65%). That’s 144 single losses and 2 pairs, or 99.35% ping success (the share of pings that got a reply).
DNS
Two valid runs: 12:29 PM (5 GHz, display off) and 2:27 PM (Ethernet). I used dig, a lookup tool, for 20 domains (10 general, 10 gaming) against the Mini’s router, 1.1.1.1 (Cloudflare), 8.8.8.8 (Google) and 9.9.9.9 (Quad9), and I left system DNS alone. “Repeat” is 60 queries per resolver, “never-cached” is 20 lookups of a random label no resolver could have stored. No query failed. Times are in milliseconds.
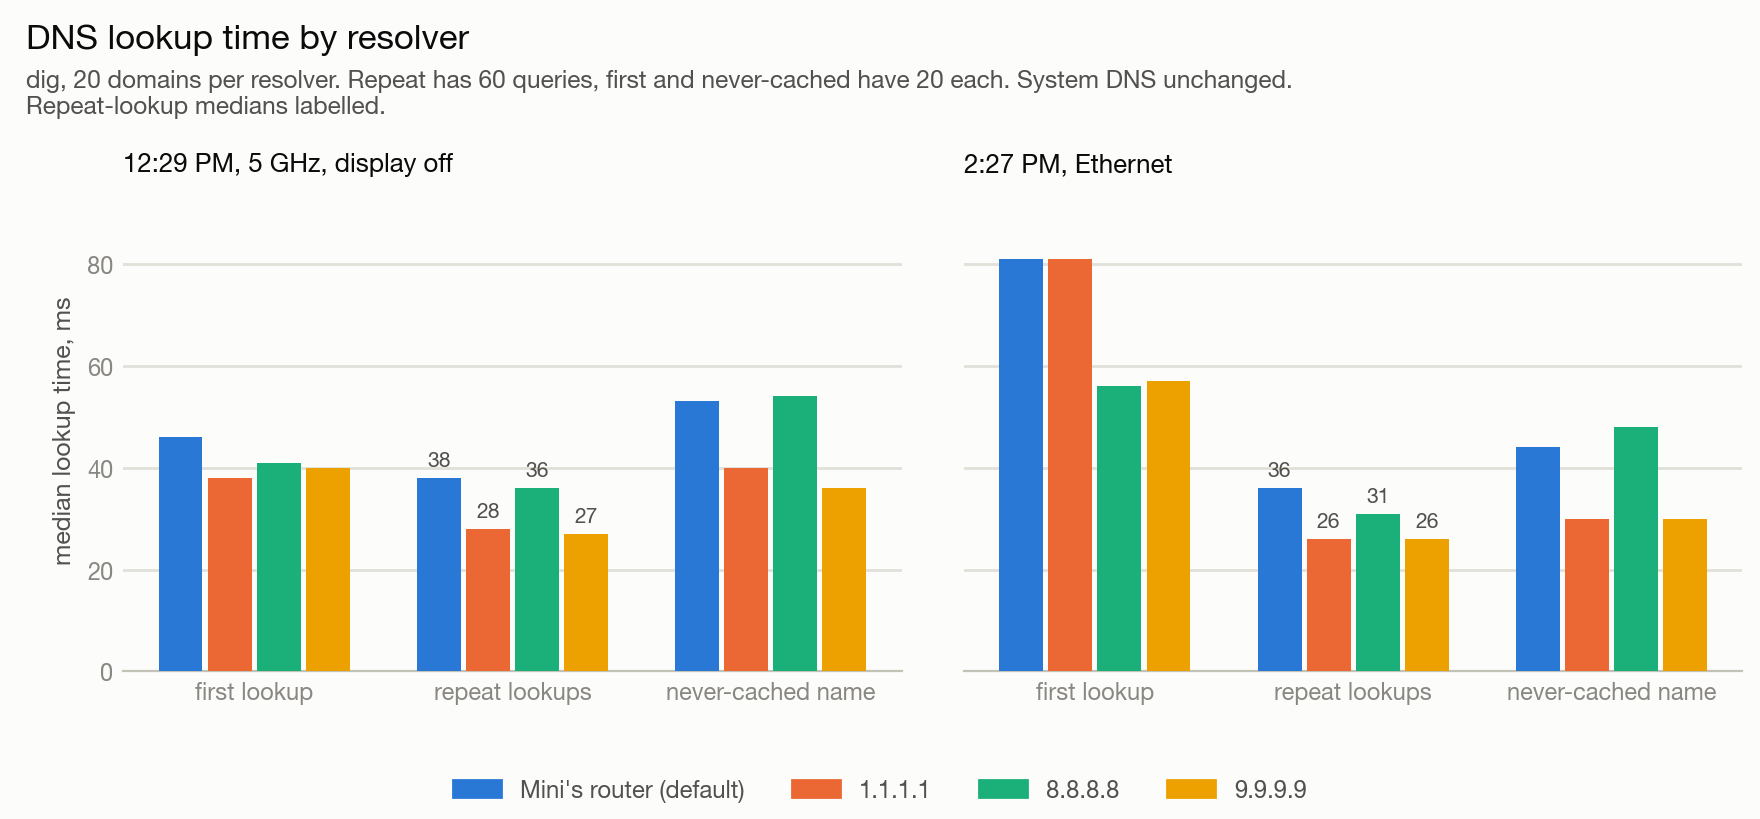
12:29 PM, 5 GHz, display off
| Resolver | Repeat lookups, median / p95 ms | Never-cached, median / p95 ms |
|---|---|---|
| Mini’s router (default) | 38 / 66 | 53 / 85 |
| 1.1.1.1 | 28 / 46 | 40 / 65 |
| 8.8.8.8 | 36 / 52 | 54 / 79 |
| 9.9.9.9 | 27 / 47 | 36 / 60 |
2:27 PM, Ethernet
| Resolver | Repeat lookups, median / p95 ms | Never-cached, median / p95 ms |
|---|---|---|
| Mini’s router (default) | 36 / 69 | 44 / 62 |
| 1.1.1.1 | 26 / 48 | 30 / 46 |
| 8.8.8.8 | 31 / 50 | 48 / 86 |
| 9.9.9.9 | 26 / 56 | 30 / 67 |
- Repeat lookups through 1.1.1.1 and 9.9.9.9 were 10 to 11 ms faster at the median than through the Mini’s router in both runs. 8.8.8.8 was 2 to 5 ms faster.
- For names no resolver could have cached, 1.1.1.1 and 9.9.9.9 were 13 to 17 ms faster than the router, and 8.8.8.8 was within 4 ms of it.
- First lookups on Ethernet were 81 ms at the median through both the router and 1.1.1.1, and 56 and 57 ms through 8.8.8.8 and 9.9.9.9.
- Every lookup includes a round trip over the satellite link, so these numbers move with link latency. Two short runs at one location.
These are lookup times only. DNS is used when you connect to services, not for the packets exchanged during play, so I can’t say it changes anything in a game. That’s a hypothesis, not a finding.
Power draw in full
The dish reports its power draw every second. That’s the draw of the whole Mini, router included, and it agrees with the wattage readout on my Bluetti battery. Over 32,227 seconds from 12:28:42 PM to 9:26:41 PM the mean (average) was 19.9 W and the median 16.8 W, with a 5th percentile of 10.4 W, a 95th percentile of 43.4 W, a minimum of 9.0 W and a maximum of 77.0 W.
| State | Seconds | Mean W |
|---|---|---|
| Idle link, 5 GHz window, 12:29-1:53 PM | 4,108 | 17.5 |
| Idle link, Ethernet, 2:00-2:53 PM | 2,499 | 16.3 |
| Idle link, Ethernet, 4:52-6:10 PM | 4,462 | 18.8 |
| Idle link, Ethernet, 6:19-8:22 PM | 7,142 | 19.2 |
| Dota 2 match plus ping burst, 4:02-4:16 PM | 840 | 20.2 |
| Ping burst only, 4:28-4:37 PM | 540 | 21.1 |
| Upload of 1 Mbps or more, 3:38-3:50 PM | 224 | 24.3 |
| Sustained download at 20 Mbps or more, 2:53-3:34 PM | 2,172 | 34.2 |
Power swings widely from second to second even when idle (5th to 95th percentile 10.4 to 41.6 W), so single readings tell you little. The power record starts at 12:28 PM, 67 minutes after power-on.
How far the Wi-Fi reaches
In the evening I carried the laptop from the van along the street and indoors, 8:34 to 8:53 PM, and stopped at each point for 30 to 100 seconds. Distances are rough phone-GPS figures. Signal is in dBm, where a number closer to zero is stronger, and link rate is the speed the Wi-Fi radios agreed on.
| Stop | Band | Signal dBm | Link rate Mbps |
|---|---|---|---|
| Near the van, outside (about 6 m, my estimate) | 5 GHz | -51 | 650 |
| Indoors, 2nd floor, near side | 5 GHz | -62 | 390 |
| Indoors, 3rd floor, near side | 5 GHz | -60 | 260 |
| Indoors, 2nd floor, far side | 5 GHz | -71 | 195 |
| Indoors, 3rd floor, far side | 5 GHz | -79 | 27 |
| Across the street (23 m) | 5 GHz | -75 | 124 |
| Down the street (50 m) | 2.4 GHz | -75 | 5 |
| Further along (distance not recorded) | 2.4 GHz | -77 | 5 |
| Further along (112 m) | 2.4 GHz | -74 | 6 |
| Further along (distance not recorded) | 2.4 GHz | -71 | 39 |
The laptop stayed on 5 GHz at every indoor stop and at 23 m. At 8:38:29 PM, between 23 m and 50 m, it fell back to 2.4 GHz. It never fully disconnected, even at 112 m. Back at the van it stayed on 2.4 GHz until I reconnected it to 5 GHz by hand. At the 23 m stop I also took one fuller measurement (5 GHz, -69 dBm): no loss to the router in 300 pings, 1.0% loss to the internet, and 19.2 Mbps down in an 8-second sample that includes connection start-up.
The loss and latency numbers from this walk are not clean. The laptop was scanning for networks 84% of the time (809 of 960 seconds), because the Wi-Fi settings page was open and because my own signal readings triggered scans. Its display was on too. So I’m not publishing the latency from the walk, and I’m not quoting exact loss percentages. Loss was under 4% at the near stops and far higher at the far ones.
Connection details
I checked these once at 3:46 PM on Ethernet.
- The second hop (the second router on the path) was 100.64.0.1, in the range reserved for carrier-grade NAT (many customers sharing one public internet address). Behind that, nothing on the internet can open an IPv4 connection to the laptop. Outbound play worked.
- The laptop had no IPv6 address and no route to IPv6 hosts. IPv4 and IPv6 are the two versions of internet addresses.
- The route to the Valve Seattle relay was 8 hops: the Mini’s router, Starlink’s carrier NAT, two hops that didn’t answer, one hop at an address I didn’t look up, then three hops in the relay’s own address block, ending at the relay.
- 1500-byte packets (the usual maximum size on Ethernet) passed without being split into smaller pieces.
If you want to try a Mini at your own site before you buy one, we rent them in Seattle. You can pick one up in South Seattle or have it shipped, and there’s a page for RV trips too.